
Hello, this is Yoshino🔫 from development. This time I would like to write an article about debugging JavaScript in Google Chrome browser.
Click here for table of contents
- 1. what is Chrome DevTools?
- 2. how to open Chrome DevTools
- 3. summary
What are Chrome DevTools?
This is a debugging tool built into the Chorme browser.
You can use the debug tool to debug the currently open web page.
How to open the Chrome DevTools
Windows: F12 or Shift + Ctrl + I
Mac: Cmd + Opt + I
This is the only way to use the sophisticated debugging tools.
I'll put a breakpoint on it.
Chrome DevTools has many debugging features, but this time I'd like to show you how to debug JavaScript using breakpoints.
When you click the part of the line number of the source code displayed in the main area, the blue arrow is displayed and the breakpoint is set. The breakpoint can be placed on the code, and when the processing of the place where it is placed runs, it pauses, and the value of the variable of the timing that stopped can be confirmed in detail.
1. Open DevTools
2. Click the Sources tab at the top of DevTools.
3. Click on the JavaScript code where you want to place the breakpoint
4. Click the line number column on the left when the code is displayed.
5.It is OK if the clicked part turns blue.
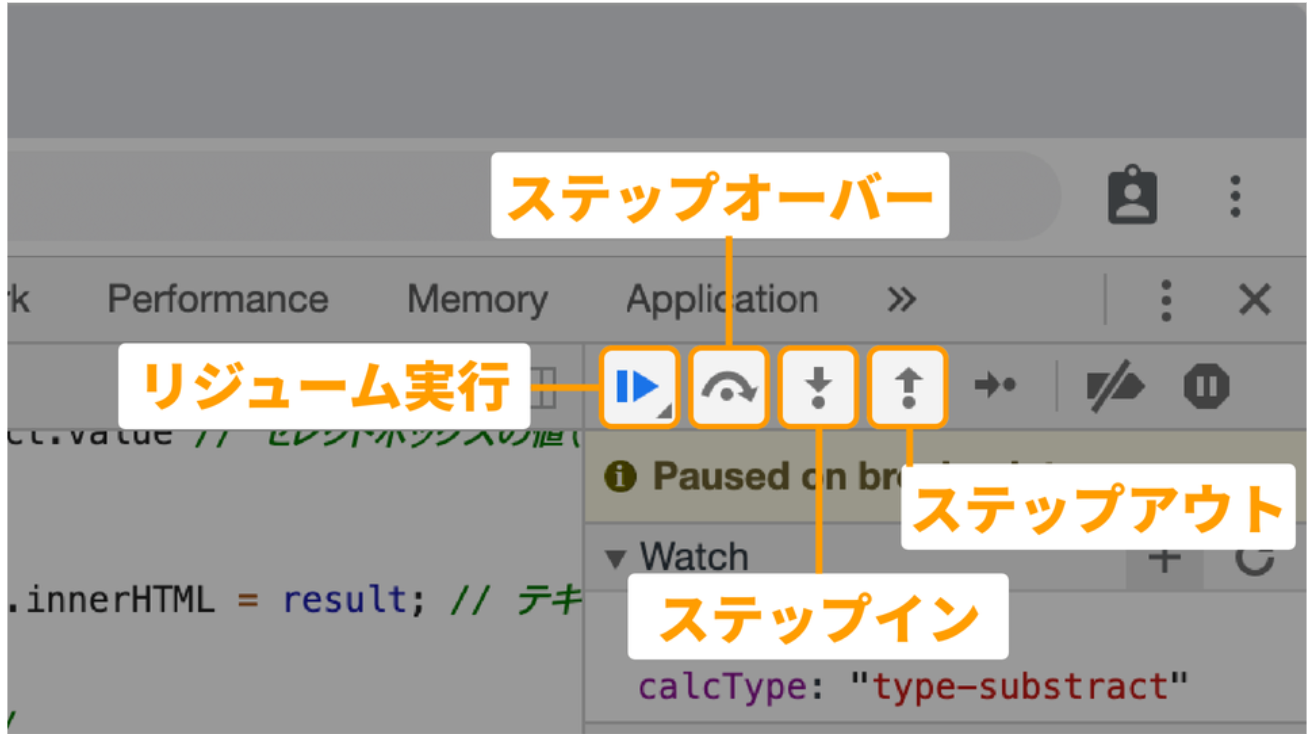
step over
Step over and step out are useful to see the general flow of the process. Stepover executes all the internal processing of the function and stops at the next line, if the function is running on the line where it is currently stopped.
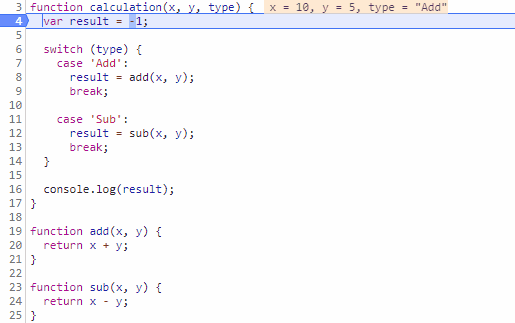
Let's say we have a function where we enter numbers in x and y and pass the calculation method in type. Let's put a breakpoint at "result = -1".
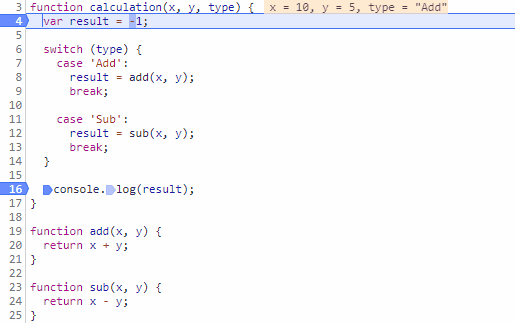
You can check the flow of the process and the value in the variable while proceeding with the code like this. This is stepping over the process by pressing the F10 key.
Step over means that when the function reaches a line, it doesn't go into the function, but pretends that it has executed the process in the function and proceeds to process the next line.
step in
However, you can't follow the contents of the add function in step over.
If you want to follow the process inside the called function, you can use step-in.

Now we can follow the process inside the add function.
The step-in process is done by pressing the F11 key.
restarting a process
Next, let's place multiple breakpoints.
By pressing the F8 key to restart the process, we were able to advance the process to the next breakpoint.
operation procedures
F8 : Resume processing
F10: Step over
F11: Step in
summary
In this article, I explained the basic debugging method when a breakpoint is placed.
In the next article, I would like to introduce setting conditional breakpoints and so on.